 Dashboards
Note
To run this app type this in a terminal:
openplotter-dashboards

Help opens an offline copy of this documentation in a browser and 
Settings opens the main app OpenPlotter Settings.
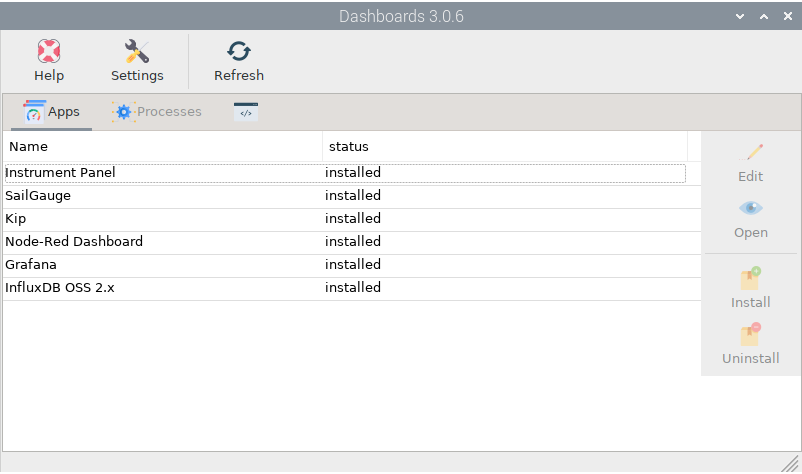
Select any app from the list and click 
Install or 
Uninstall. Click 
Refresh after any of these actions to refresh the list.
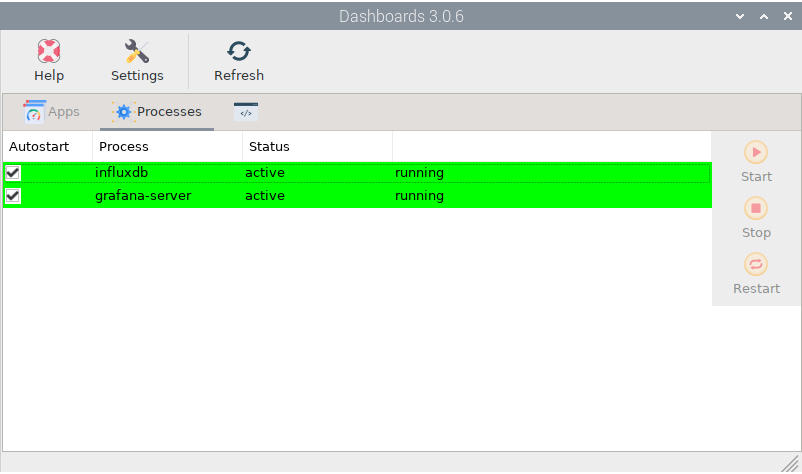
Most of these dashboards are Signal K server plugins, but some are standalone third-party applications such as Grafana or InfluxDB. Once these applications are installed you can 
Start, 
Stop, 
Restart and configure automatic startup by toggling Autostart in the  Processes tab:
Instrument Panel
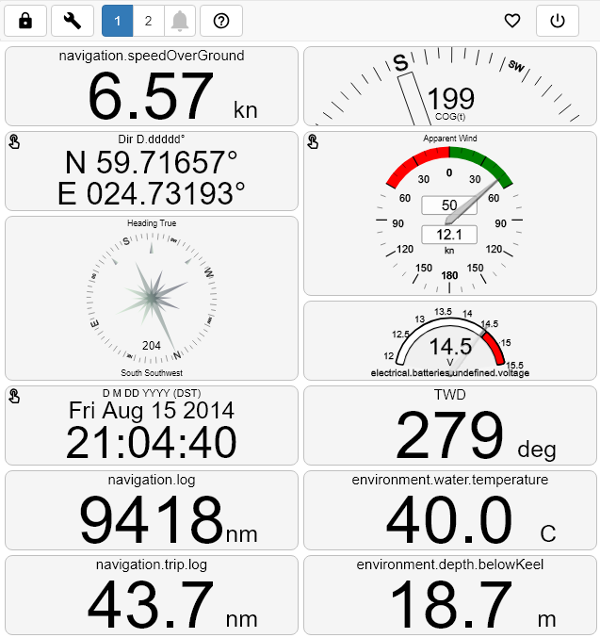
This is the dashboard built into the Signal K server. It is highly configurable and you can even embed panels from other applications like Grafana.
You can access this dashboard by selecting Instrument Panel in the list and clicking 
Open or by typing this adddress in your local browser: http://localhost:3000/@signalk/instrumentpanel/. You can also connect to this page from any device connected to the same network as OpenPlotter using the address http://openplotter.local:3000/@signalk/instrumentpanel/.
Click on the ![]() help icon to access full documtnation.
help icon to access full documtnation.
SailGauge
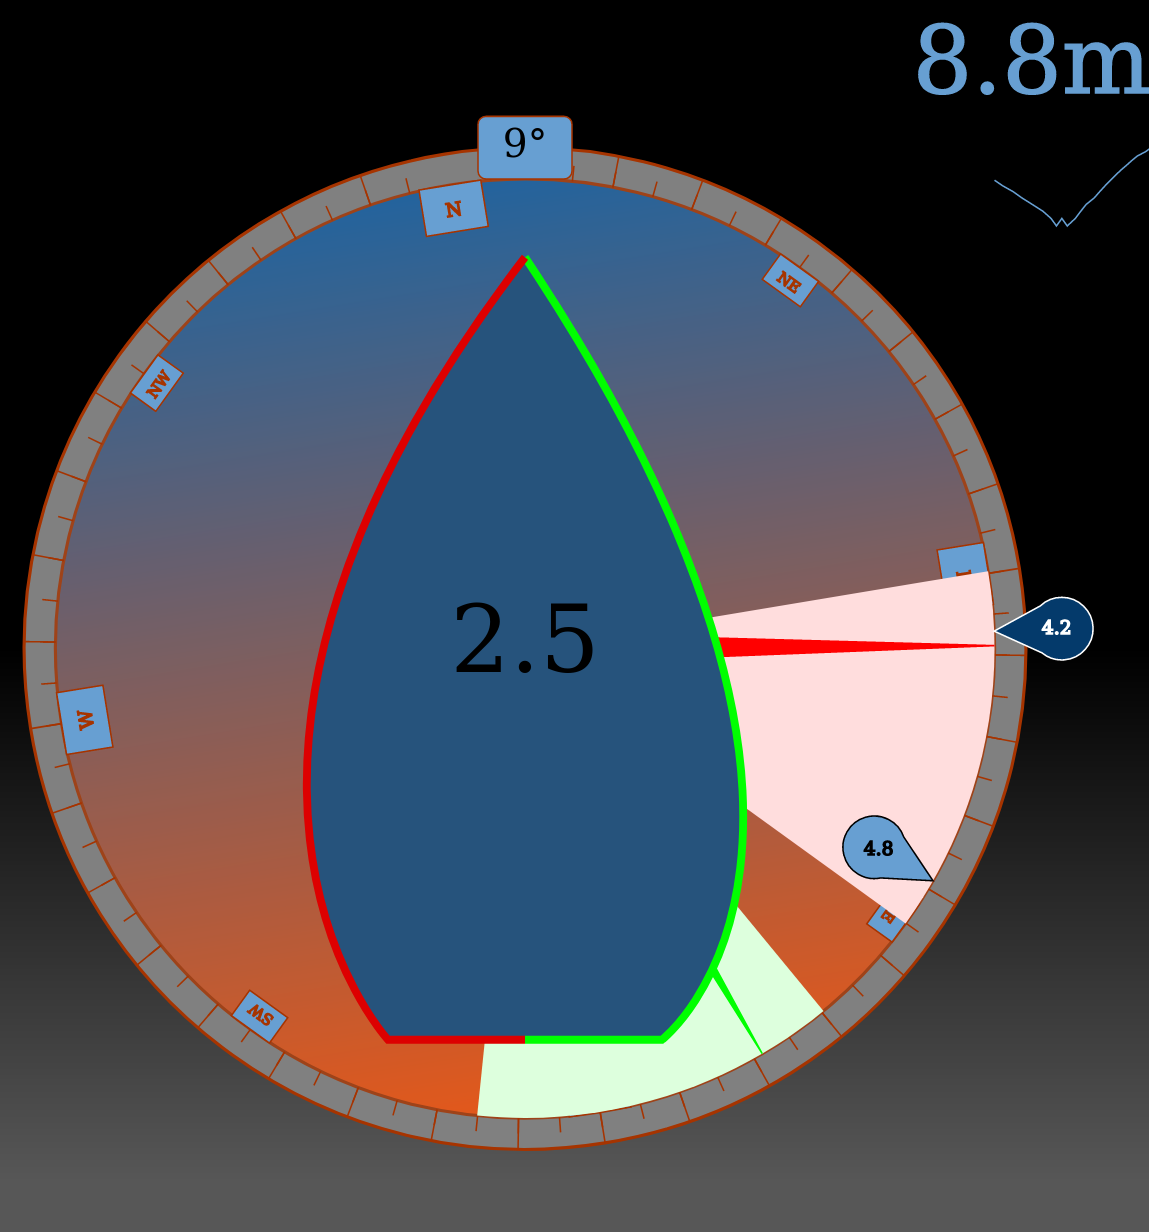
This signal K server plugin provides an all-in-one gauge for sailboats.
You can access this dashboard by selecting SailGauge in the list and clicking Open or by typing this adddress in your local browser: http://localhost:3000/@signalk/sailgauge/. You can also connect to this page from any device connected to the same network as OpenPlotter using the address http://openplotter.local:3000/@signalk/sailgauge/.
Kip
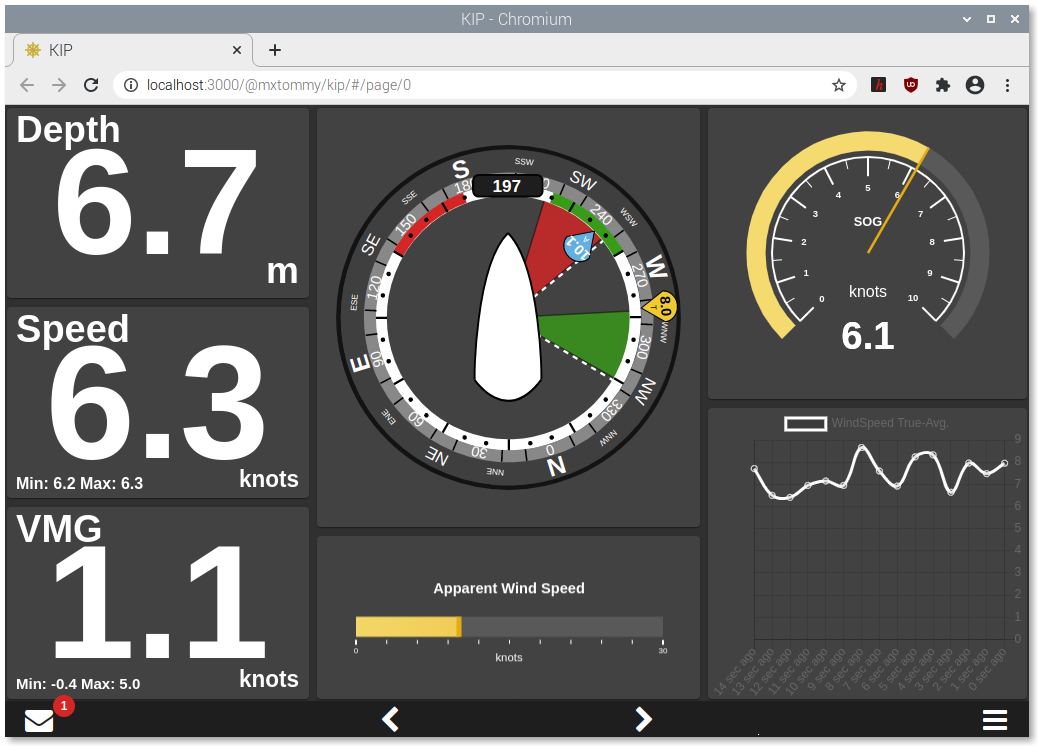
Using this wonderful Signal K plugin you will be able to easily build sexy dashboards containing graphs, gauges, numeric and level panels…
You can access this dashboard by selecting Kip in the list and clicking Open or by typing this adddress in your local browser: http://localhost:3000/@mxtommy/kip/. You can also connect to this page from any device connected to the same network as OpenPlotter using the address http://openplotter.local:3000/@mxtommy/kip/.
Go to the plugin homepage for the list of features and tips: https://github.com/mxtommy/Kip
Node-Red Dashboard
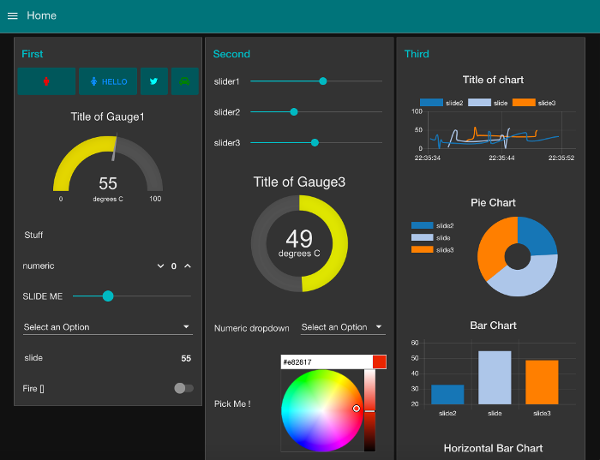
Node-RED is a tool that uses a browser-based visual editor to program the connections between hardware devices, and APIs such as Signal K. It allows you to gather, adjust, enhance and deliver the data without needing to understand complex programming languages such as C or Python.
In OpenPlotter, Node-RED is embedded in the Signal K server as a plugin, and contains some specific nodes to manage Signal K data. Go to the plugin homepage to see the list of nodes and some examples: https://github.com/SignalK/node-red-embedded
The installation also includes the node-red-dashboard plugin that adds more nodes for creating buttons, graphs, gauges, sliders, and so on.
You can build Node-RED dashboards by selecting Node-Red Dashboard in the list and clicking 
Edit or by typing this adddress in your local browser: http://localhost:3000/plugins/signalk-node-red/redAdmin/. You can also connect to this page from any device connected to the same network as OpenPlotter using the address http://openplotter.local:3000/plugins/signalk-node-red/redAdmin/.
You can see your Node-RED dashboards in action by selecting Node-Red Dashboard in the list and clicking Open or by typing this adddress in your local browser: http://localhost:3000/plugins/signalk-node-red/redApi/ui/. You can also connect to this page from any device connected to the same network as OpenPlotter using the address http://openplotter.local:3000/plugins/signalk-node-red/redApi/ui/.
Using and learning Node-RED takes some time and is not the goal of this document. If you are not a programmer but would like to learn some basic principles, Node-RED is the perfect starting point. Everything will be possible in OpenPlotter using Node-RED.
Go to the Node-RED homepage to get started: https://nodered.org/docs
Go to our dedicated forum to share or ask about Node-RED in OpenPlotter: https://forum.openmarine.net/forumdisplay.php?fid=15